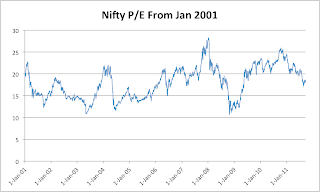
 With NSE's latest website now you can easily get current as well as historical data about important valuation parameters for markets in general such as PE, PBV, Dividend Yield etc.
We all talk about stock specific valuation in terms for it's yield, or PE but broader valuation of the market is equally important to consider as however undervalued a stock is if overall market is selling off the stock will fall and there is very high probability that you can get that stock cheaper. Same is true vice-versa i.e one should try to avoid selling stock they hold just because there is gloom and doom in the market but the market valuation is near the historical lows.
NSE Nifty PE Chart is very handy and provides a quick reference to the overall valuation of the market. Since Nifty consists of 50 large stocks listed on National Stock Exchanges the valuation of the index more or less represents the valuation of market. Though if you want you can also plot charts for other indices such as Junior Nifty, Midcap 50, sector indices etc.


